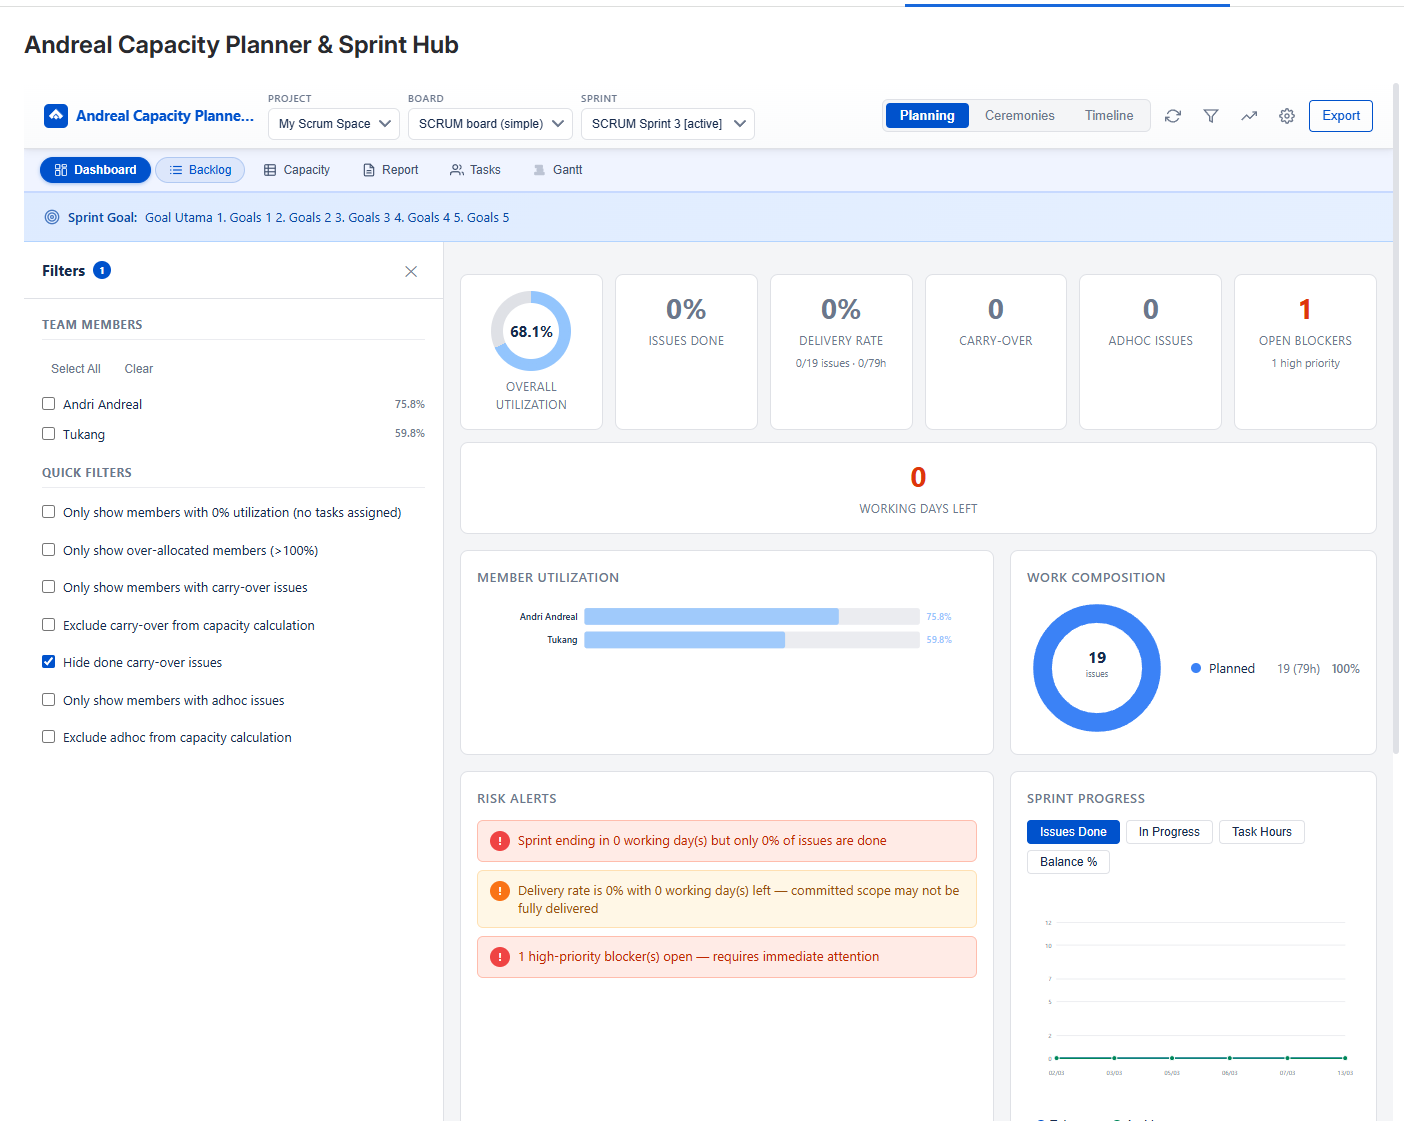
Your sprint at a glance. Summary cards for utilization, delivery rate, carry-over,
adhoc, open blockers, and days left. Member utilization bar chart, work composition donut,
risk alerts, sprint trend chart, and leaderboard.
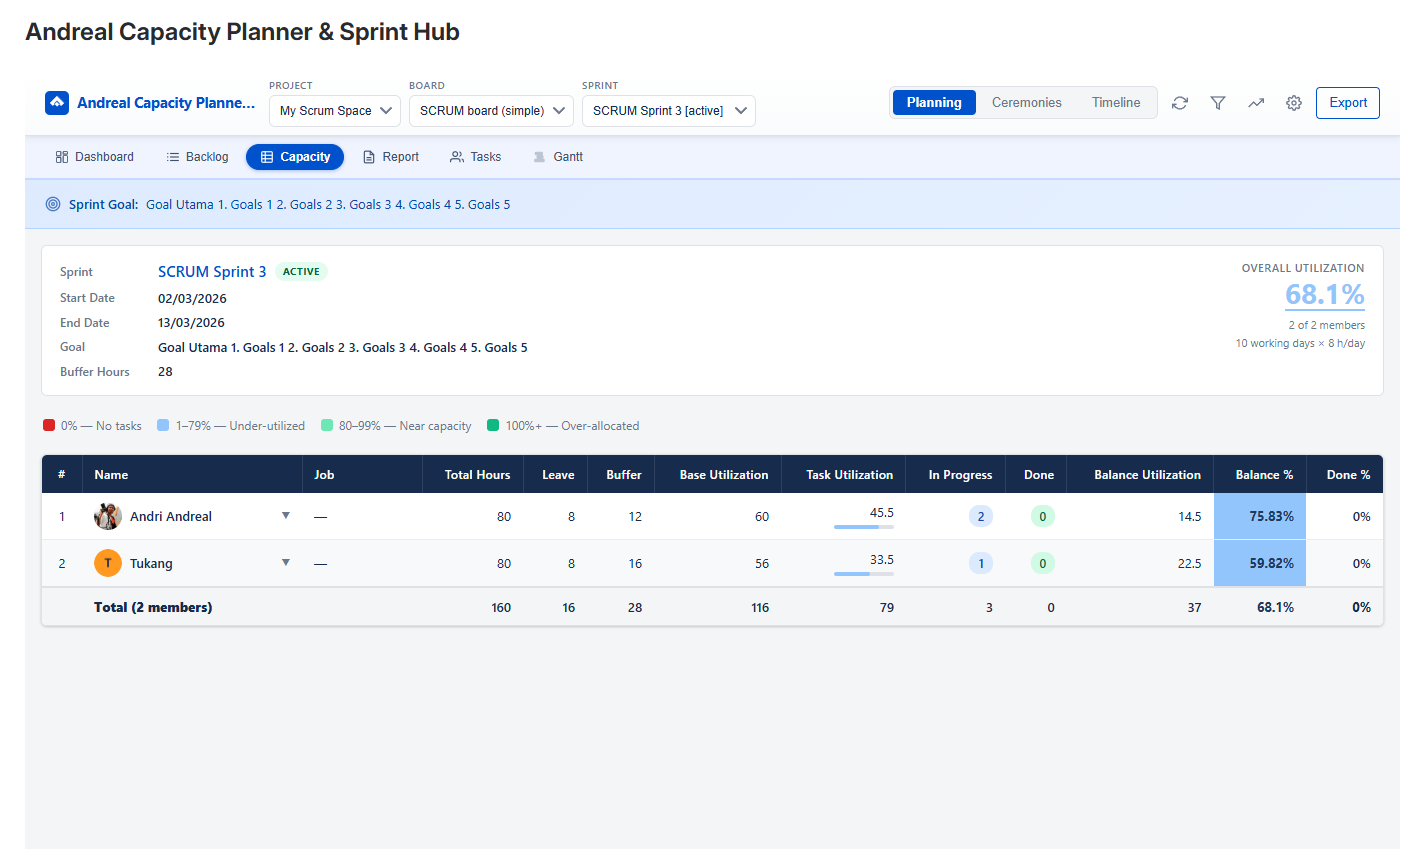
Detailed per-member capacity breakdown with expandable issue rows.
See hours, leave, buffer, utilization, priority, status, carry-over
and adhoc badges for every task.
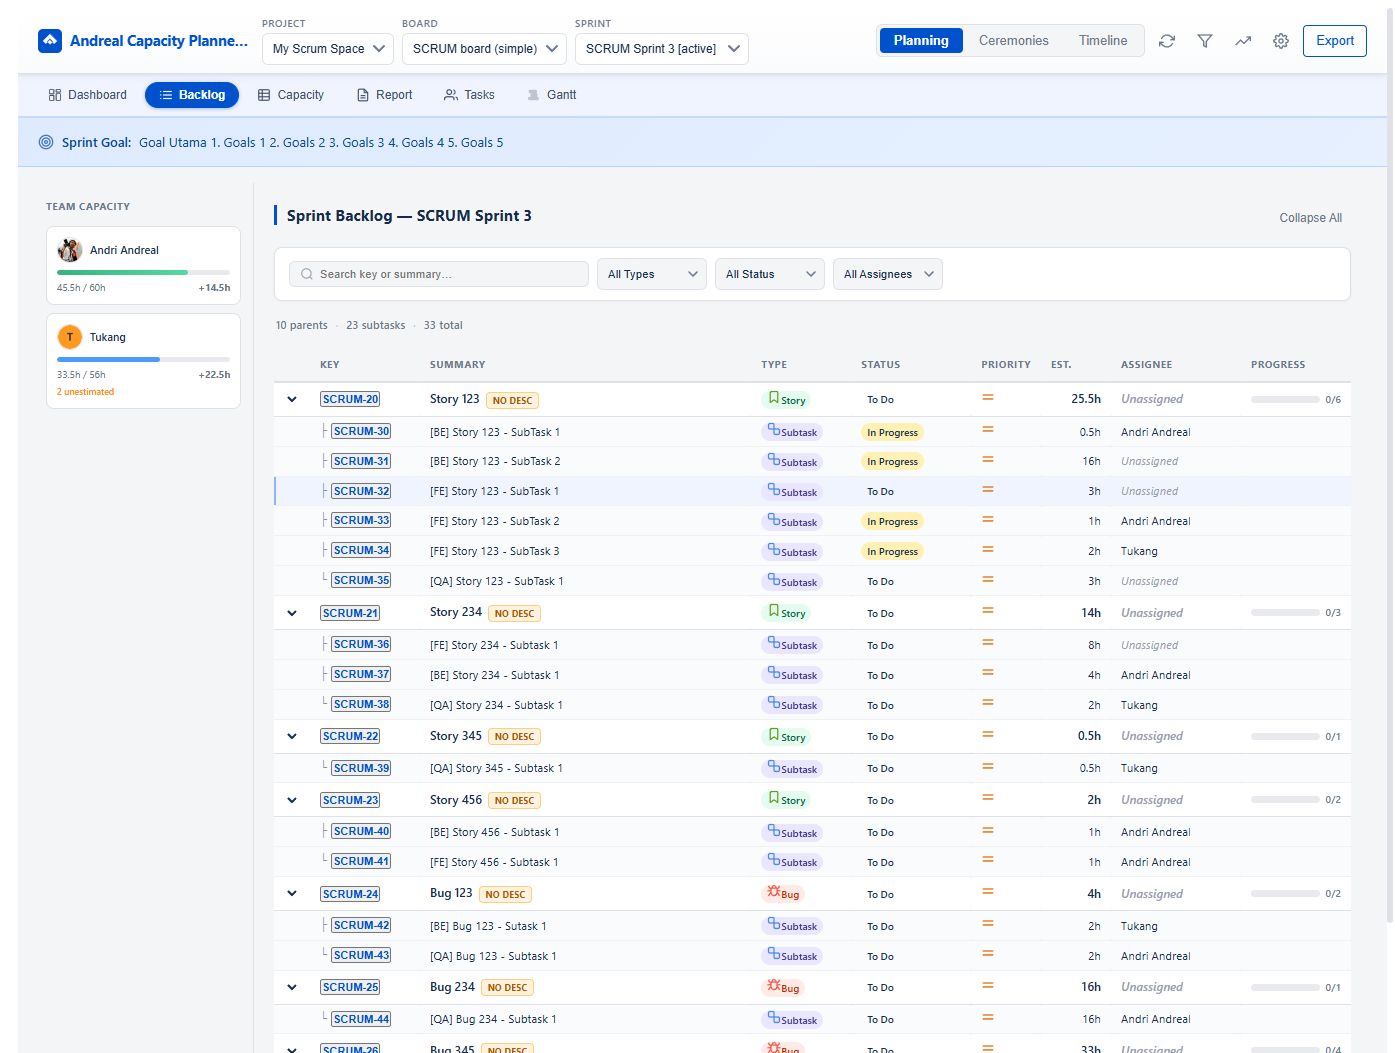
Full sprint backlog grouped by parent story. See team capacity sidebar,
search by key or summary, filter by type, status, or assignee.
Track estimation progress per story.
Variance analysis for every issue: estimated vs. actual hours with
color-coded indicators. Includes impediments/blockers section and
worklog descriptions so you know exactly why tasks went over or under.
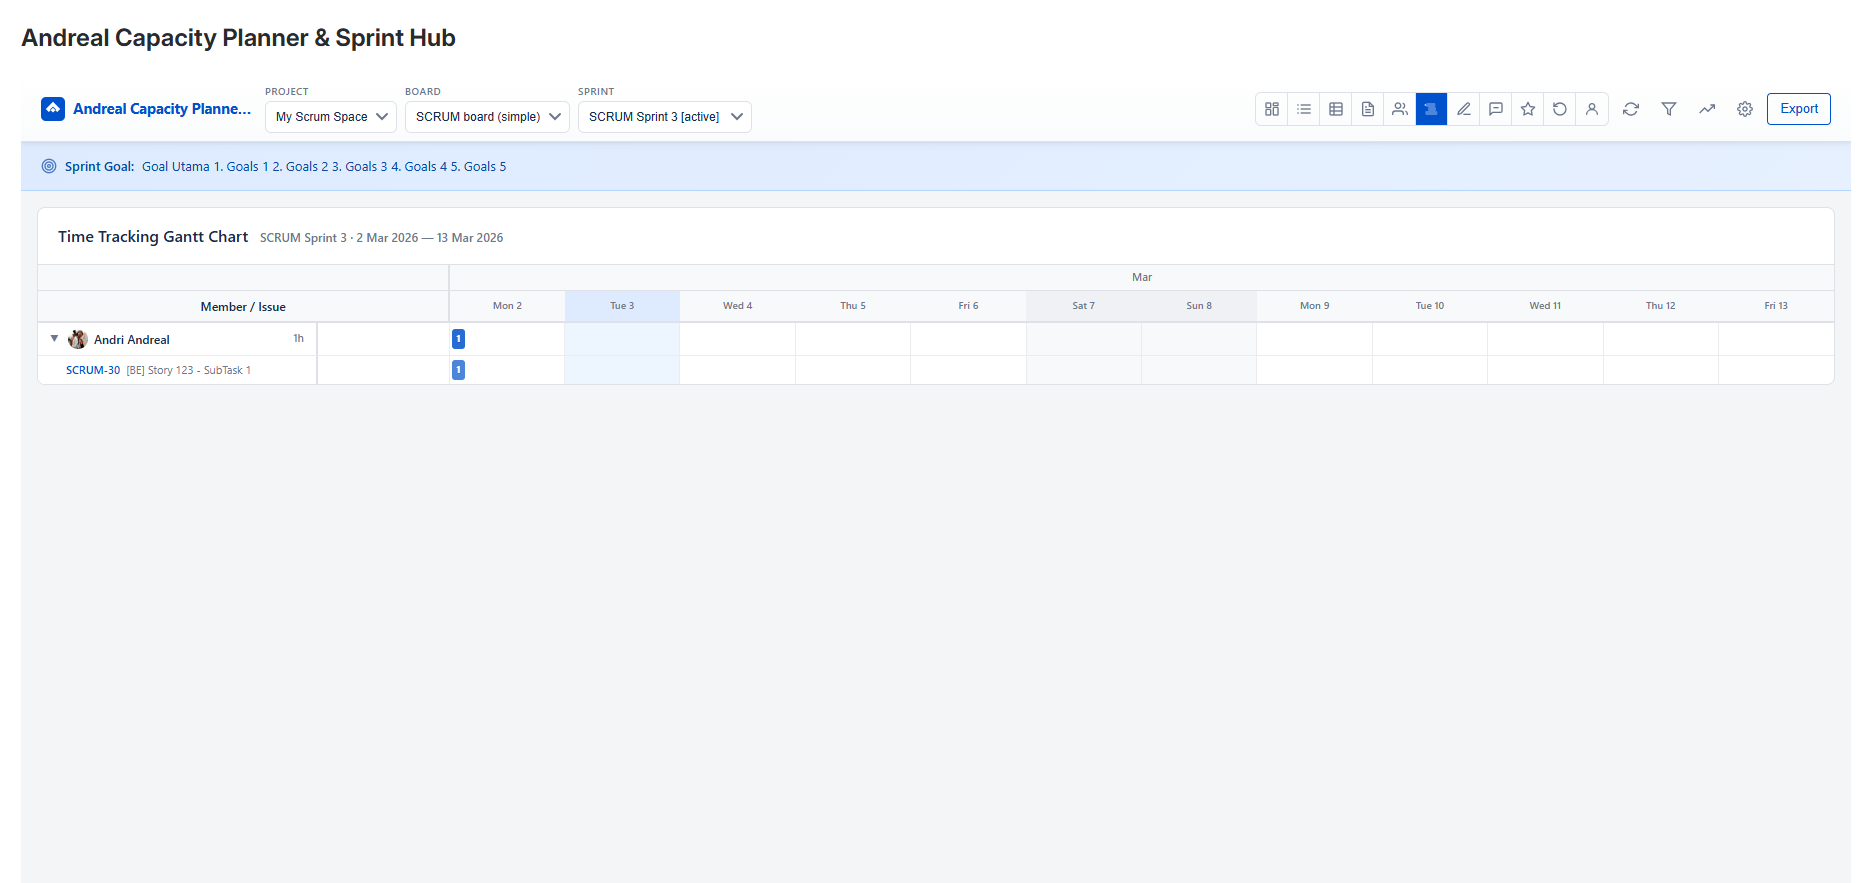
Visualize time tracking across the sprint timeline. See when and how long
each member worked on every issue, with collapsible rows, worklog tooltips,
and today highlighting.
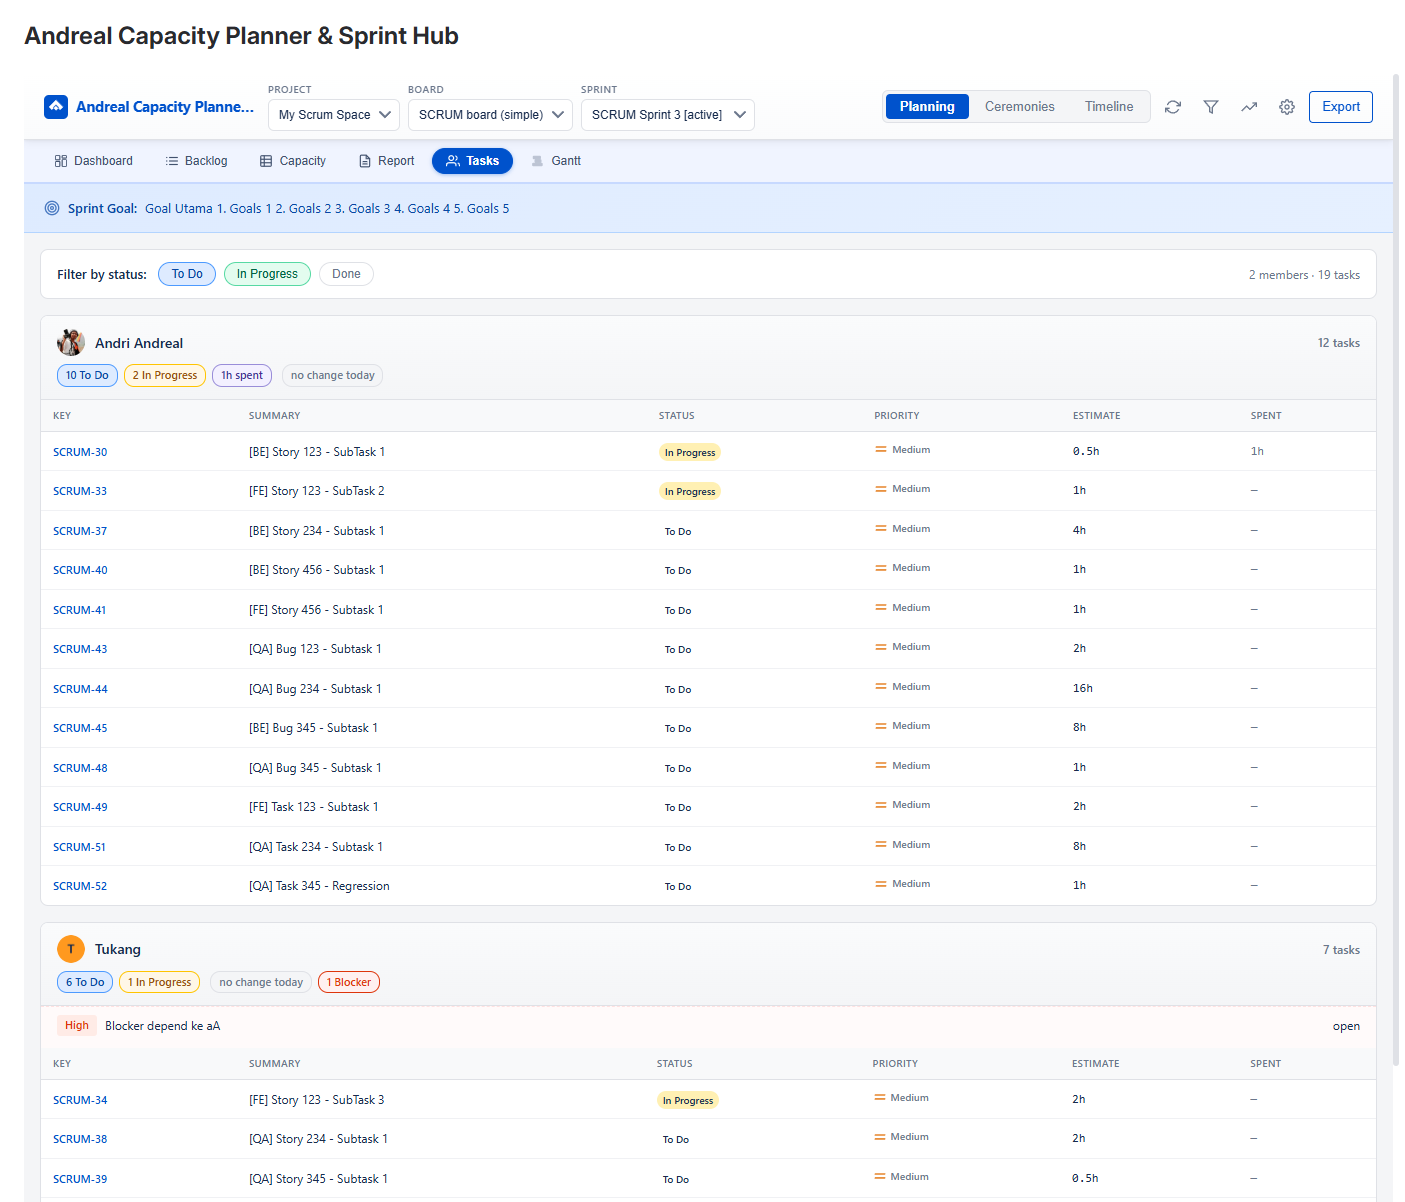
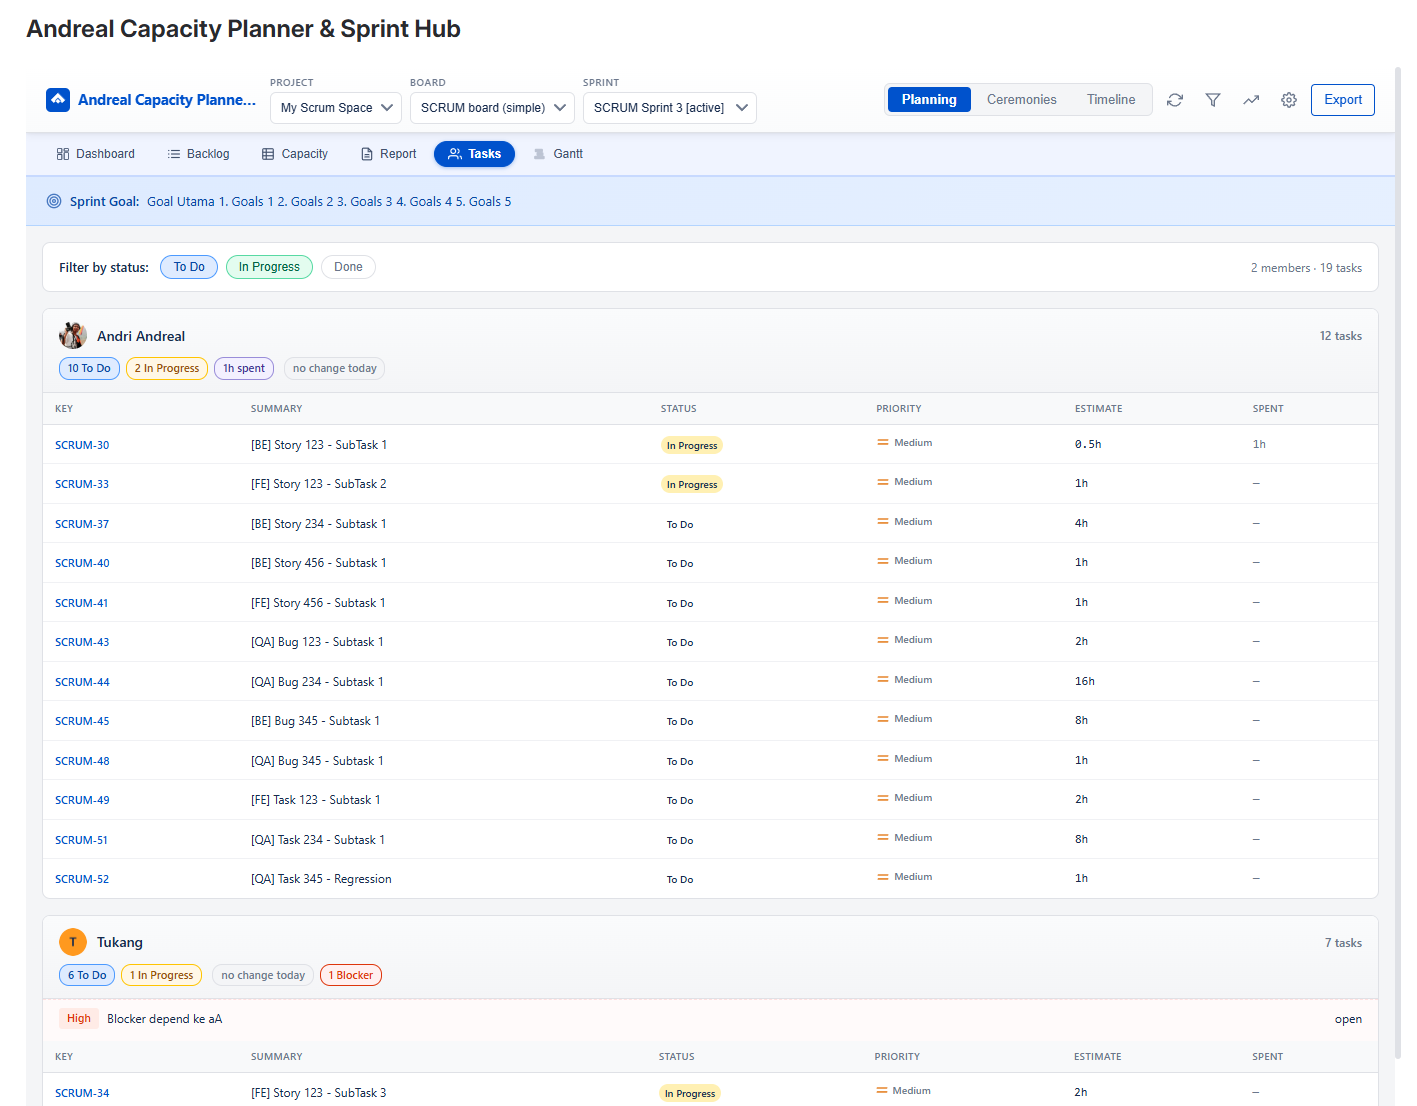
See who's working on what. Filter by status (To Do, In Progress, Done)
and instantly see each member's task list with priority and estimates.
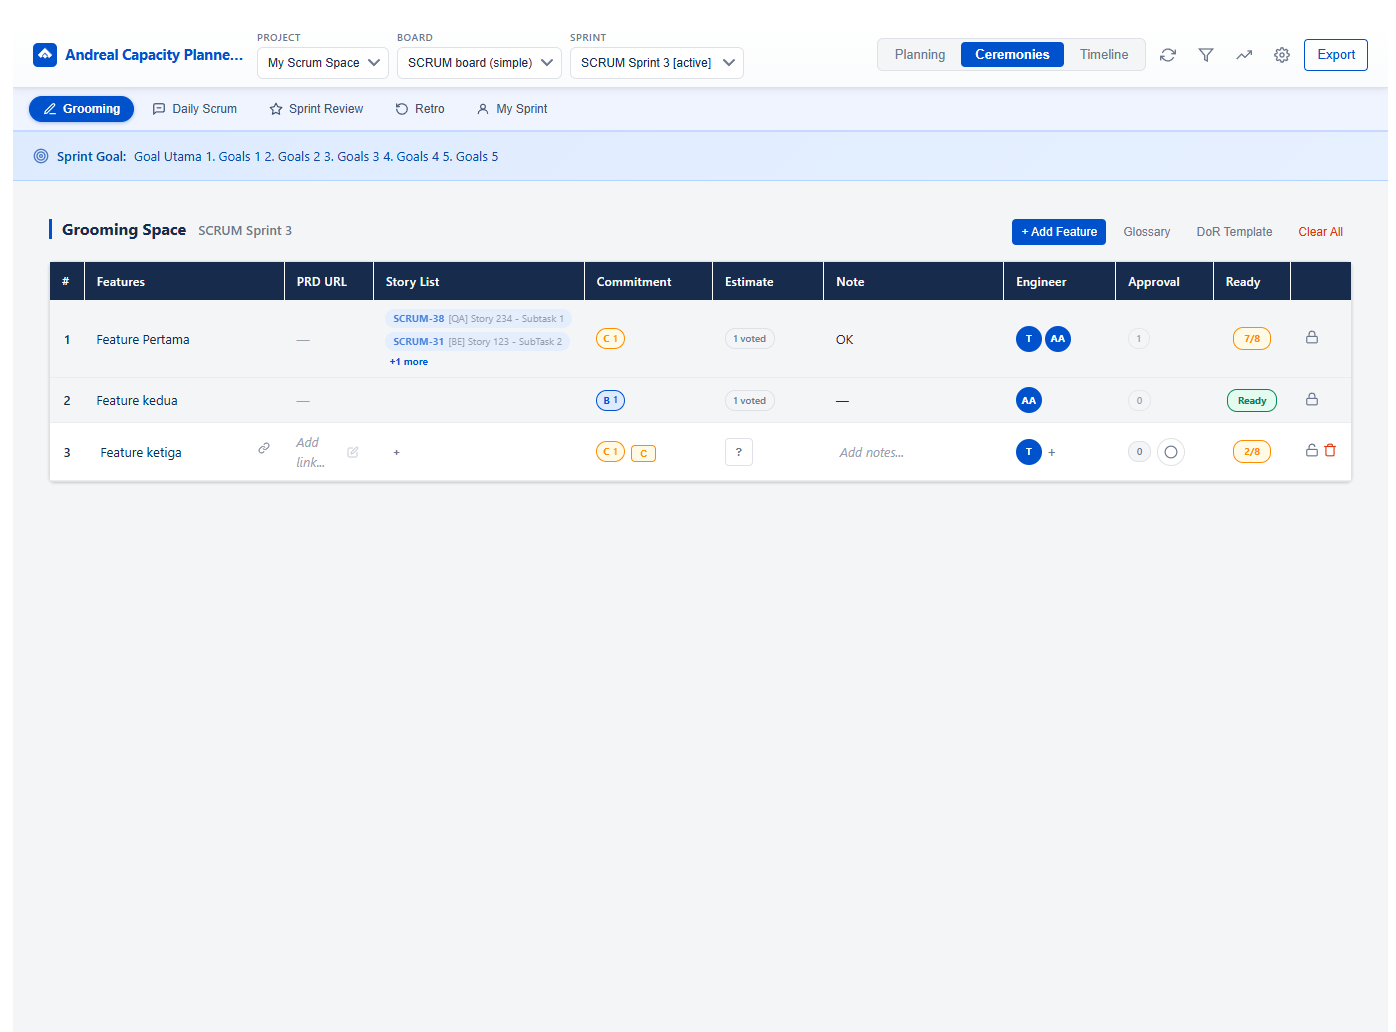
Collaborative sprint grooming with planning poker voting, story linking,
PRD URLs, commitment tracking, Definition of Ready checklist, and
per-feature readiness status.
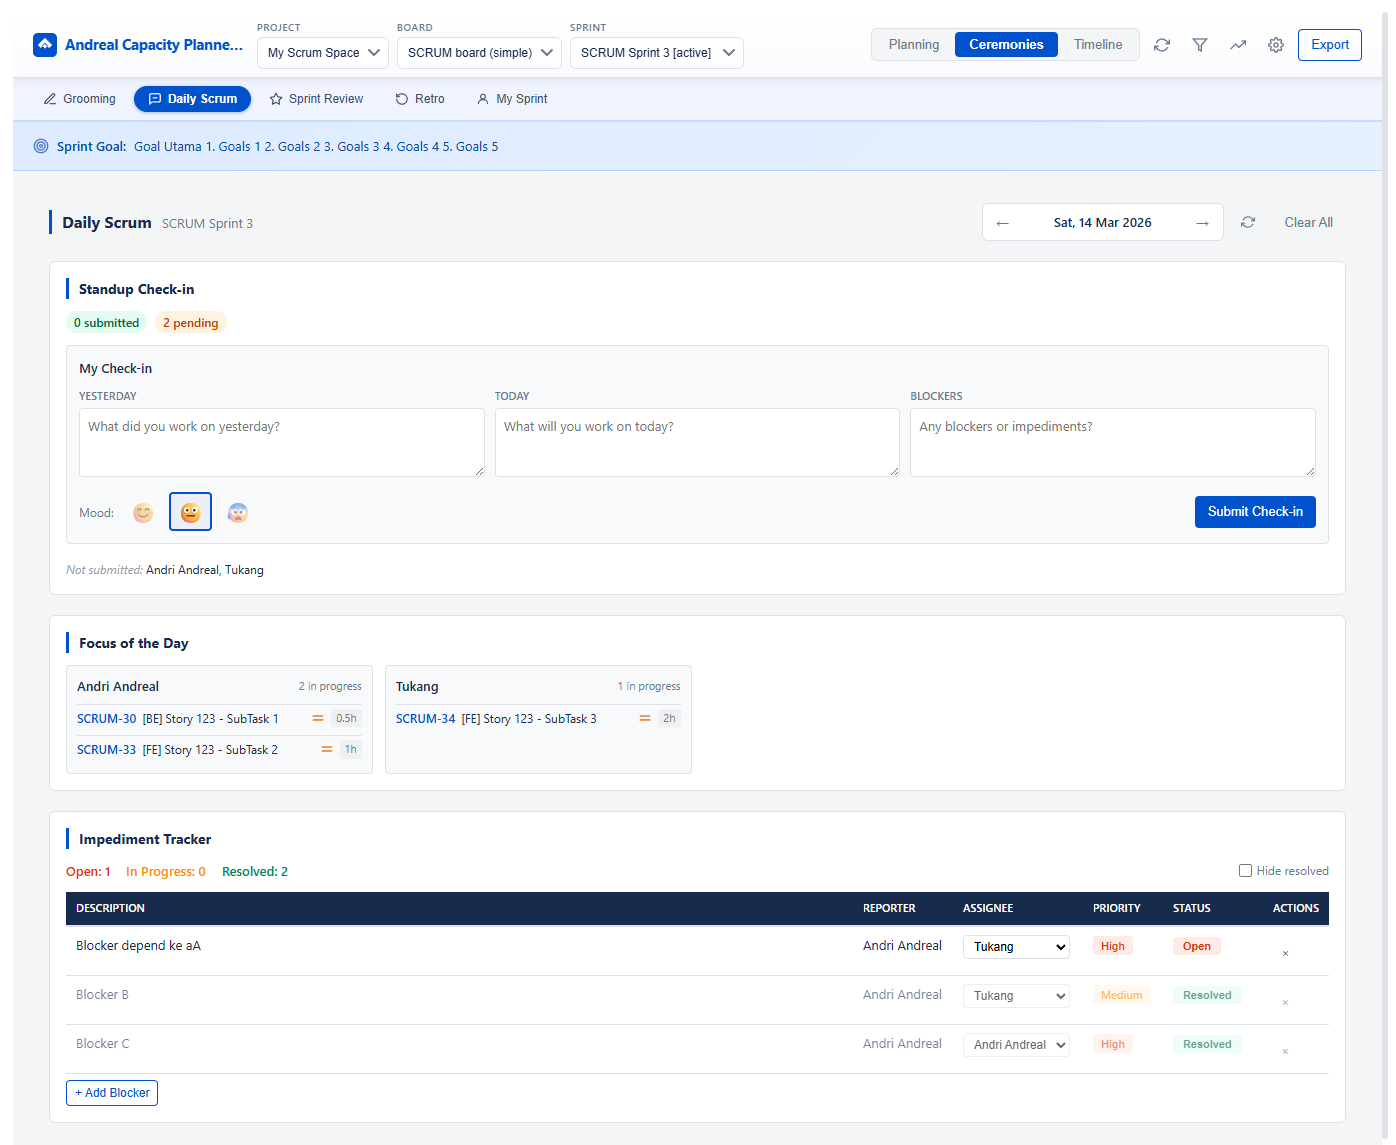
Structured daily standup with check-in form (yesterday, today, blockers),
mood tracking, team update summary, and focus-of-the-day per member.
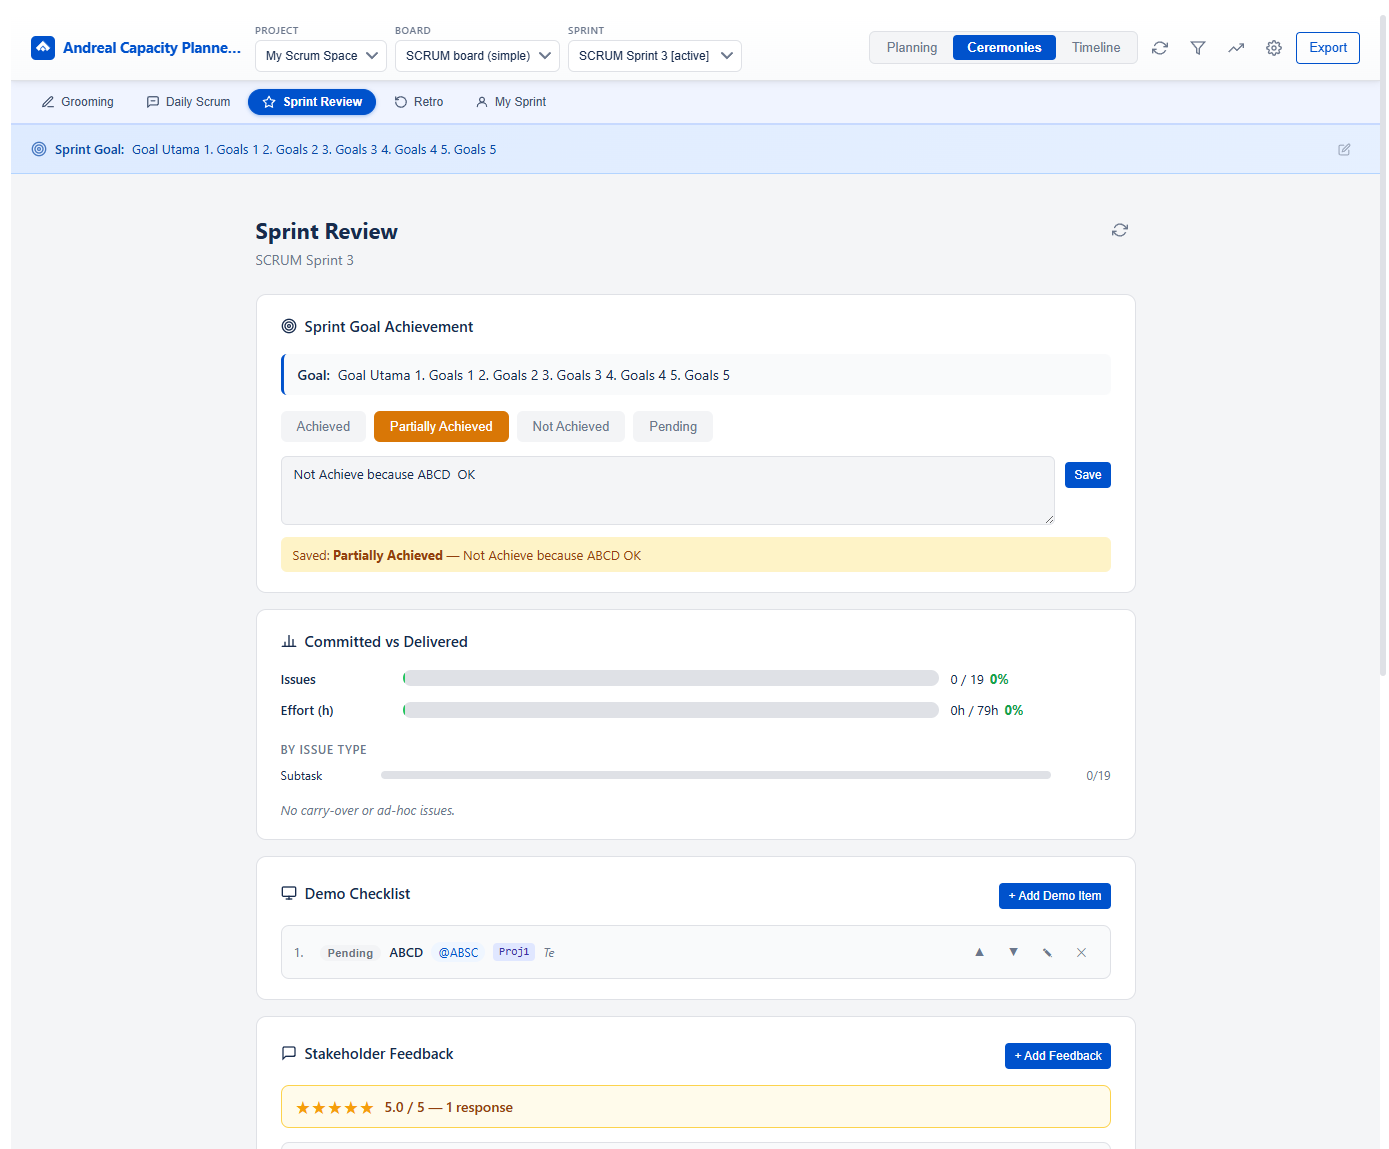
Structured sprint review with goal achievement tracking, committed vs.
delivered metrics by issue type, and a demo checklist for presenting
to stakeholders.
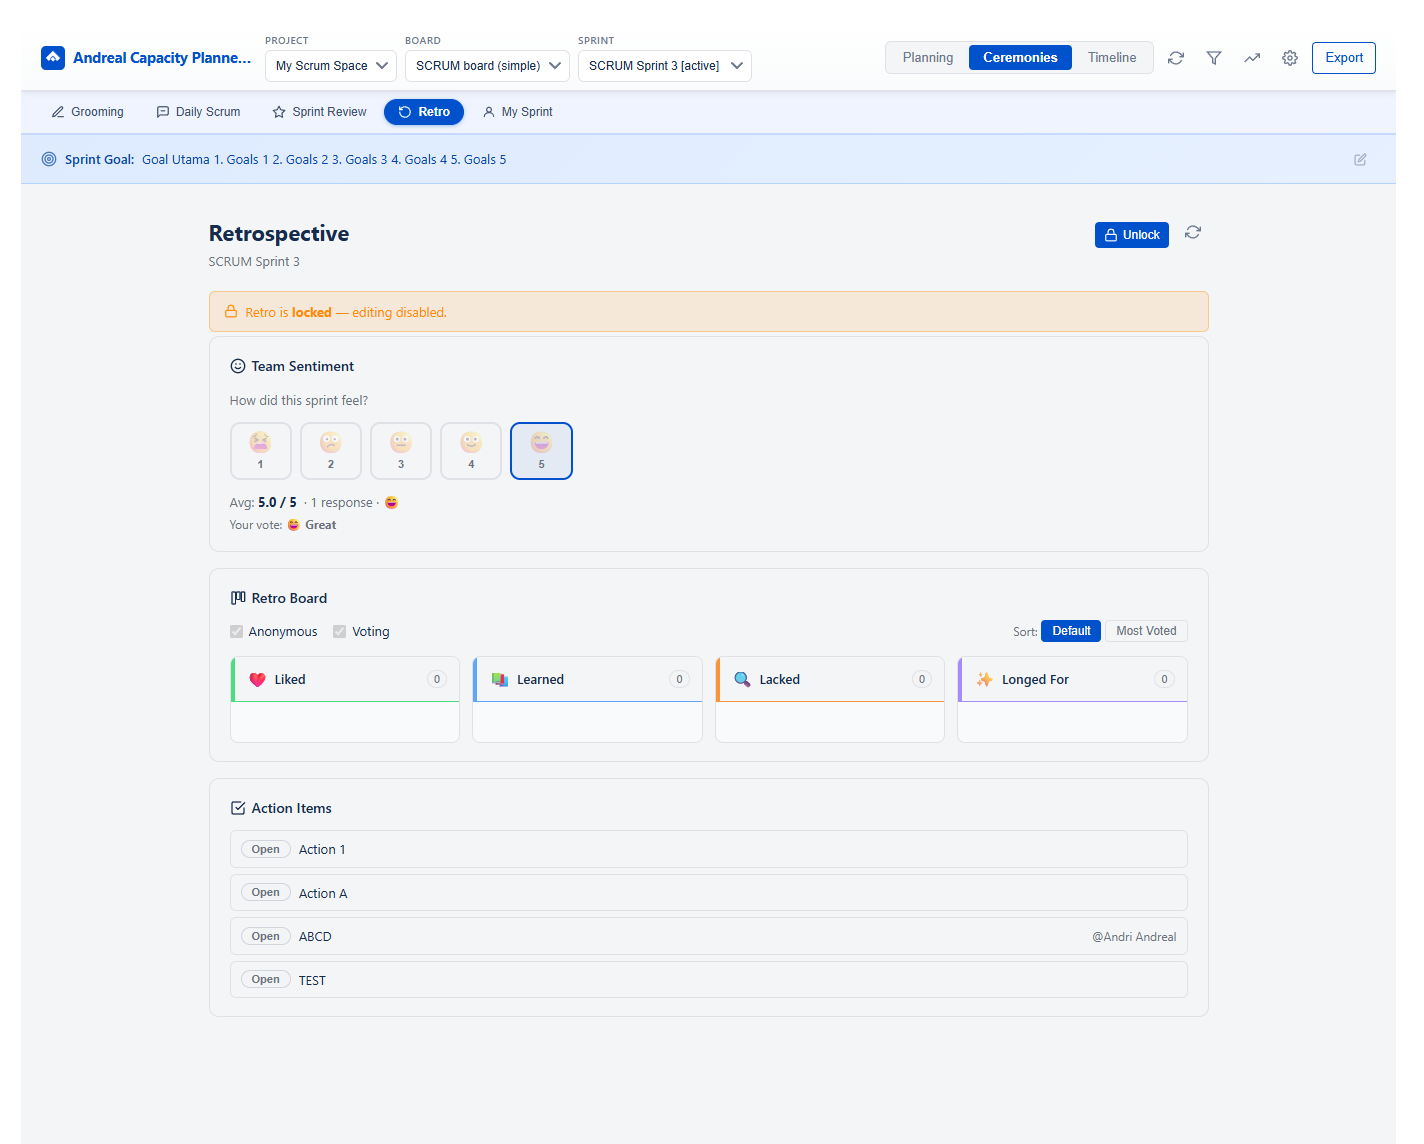
Built-in retro board with Start / Stop / Continue (or custom templates),
team sentiment rating, anonymous & voting modes, and action items
tracking — all saved per sprint.
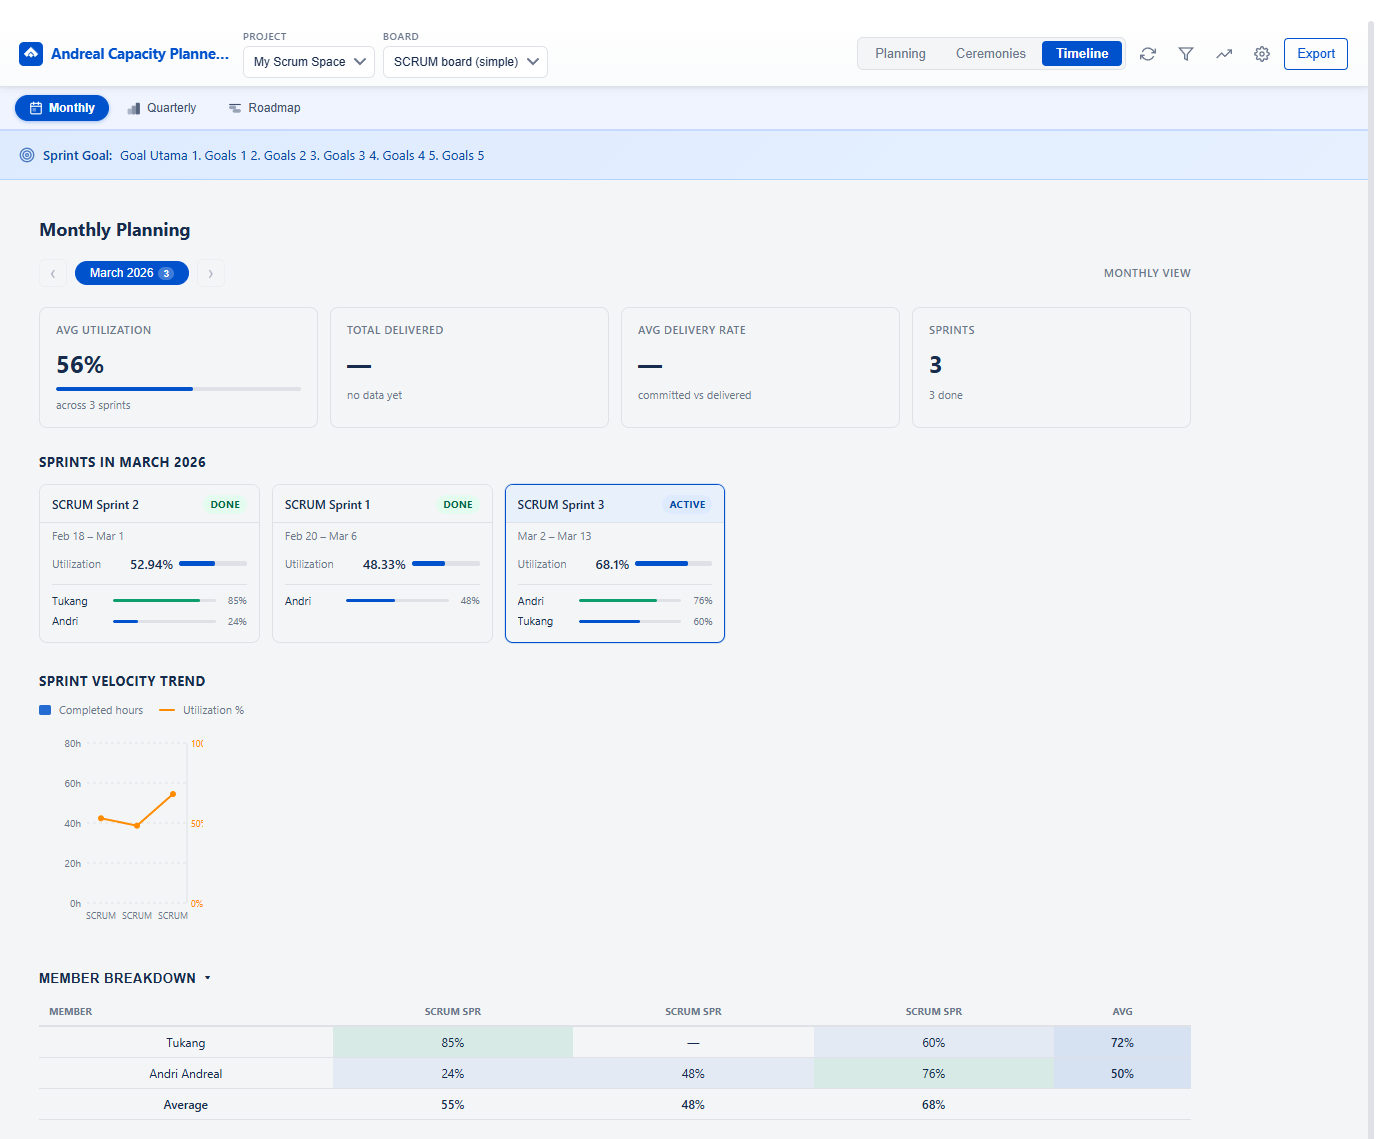
See all sprints within a month in one view. Track avg utilization,
total delivered, delivery rate, and sprint count. Per-sprint cards
show member utilization bars, velocity trend chart, and a full
member breakdown table across sprints.
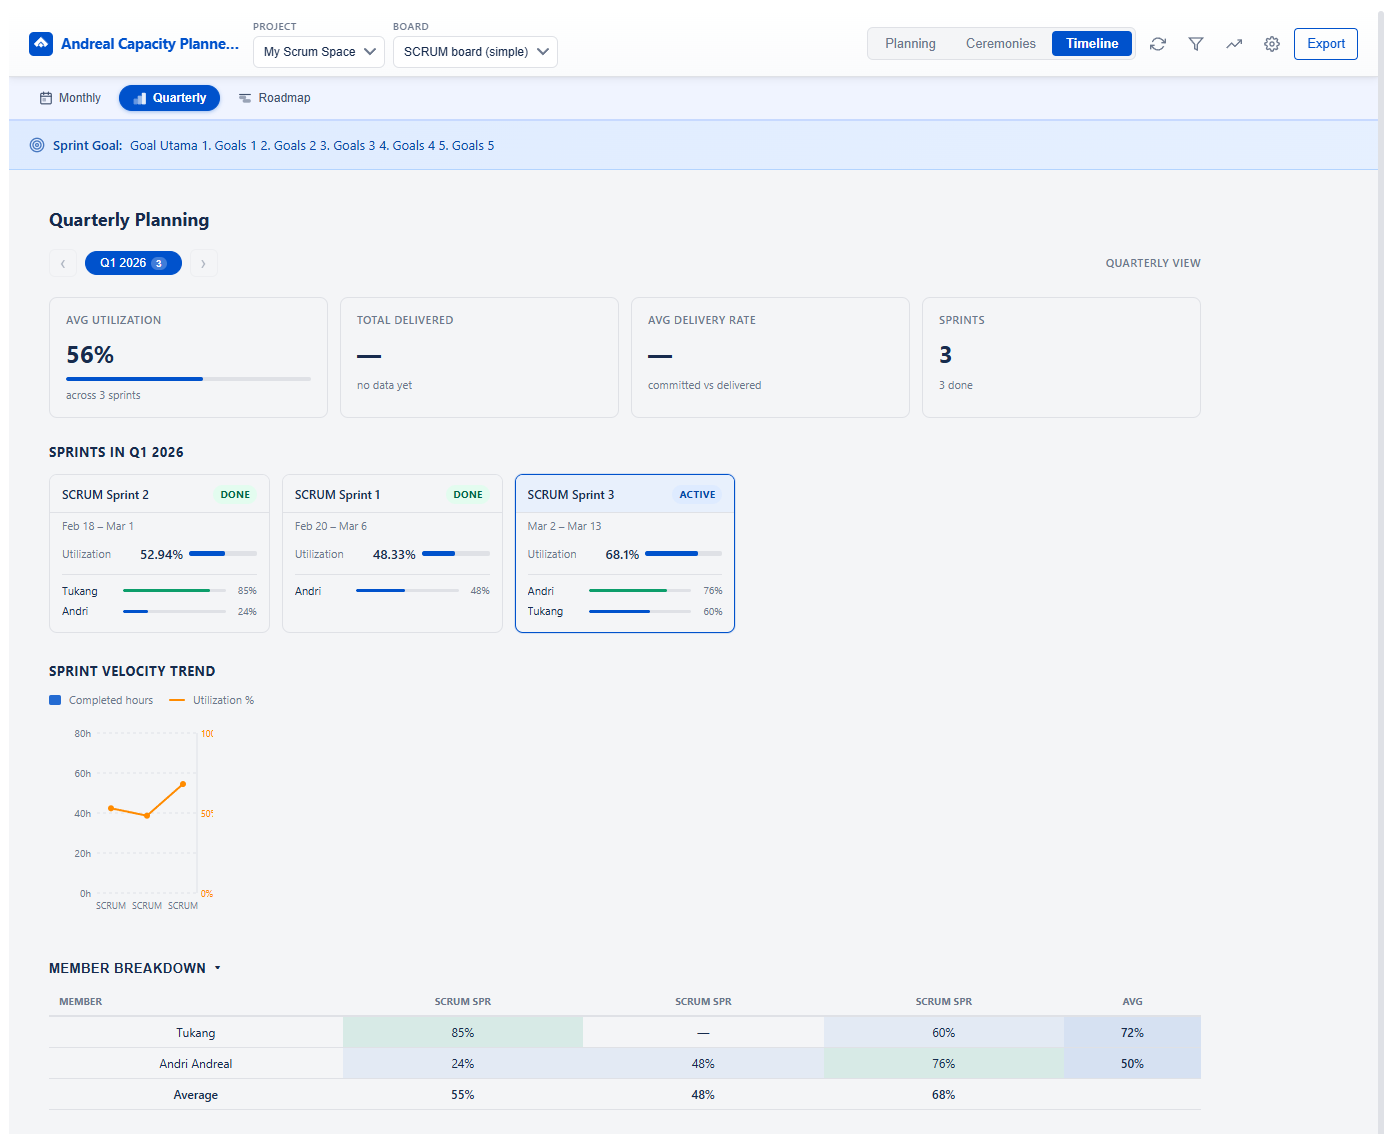
Quarter-by-quarter view of all sprints grouped by quarter. Navigate
between Q1–Q4 with summary metrics, sprint velocity trend, and a
cross-sprint member utilization breakdown — great for planning and
retrospective insights.
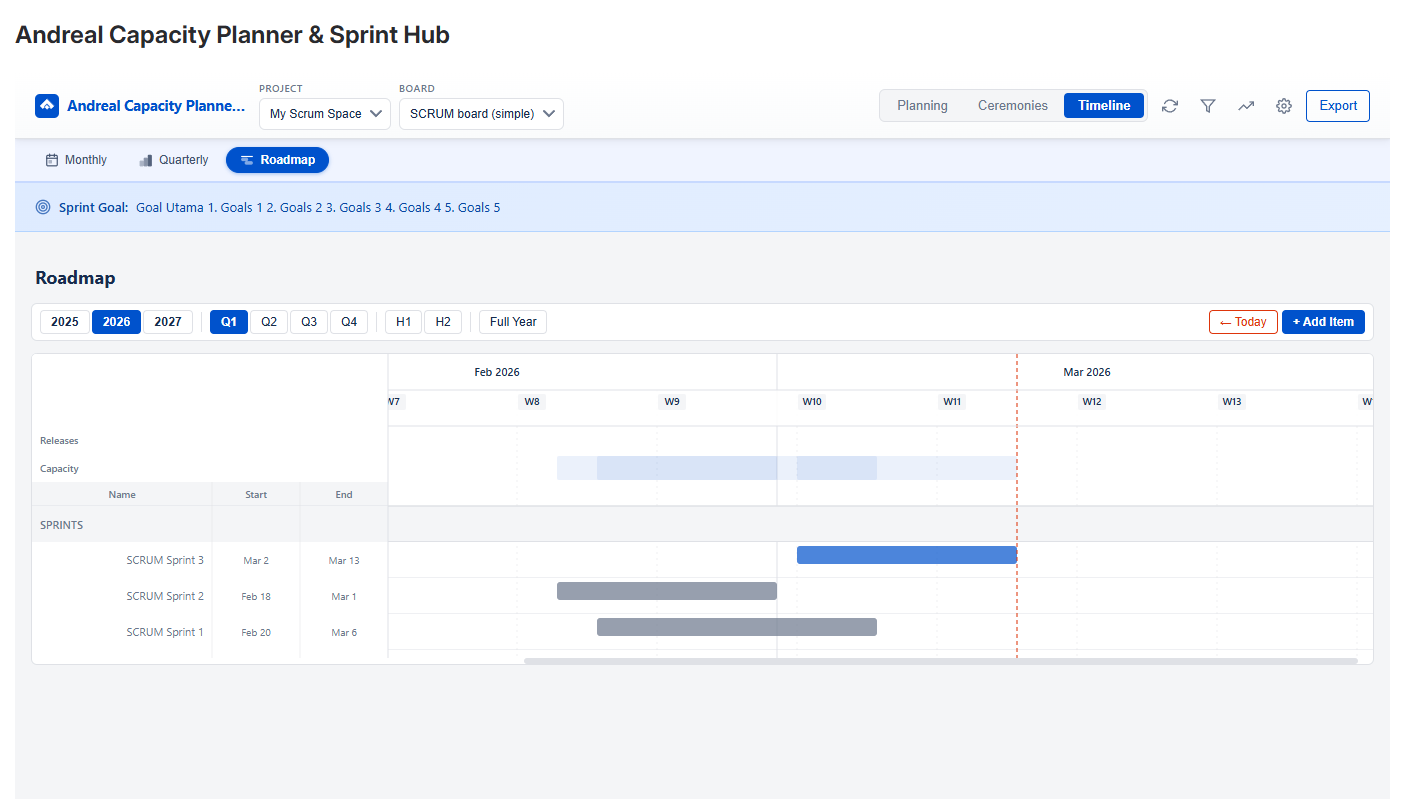
Visual Gantt timeline showing sprints and custom roadmap items side by side.
Drag & resize bars, group items by category, define dependencies with
arrows, and plan across Q1–Q4 or the full year. Persisted automatically
per board.